
Want more ideas and freebies?
Get my free resource library with digital & print activities—plus tips over email.
Join for Free Resources →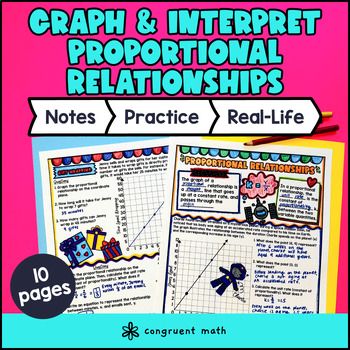
$4.25
Ever wondered how to teach proportional relationships in an engaging way to your 7th and 8th grade students?
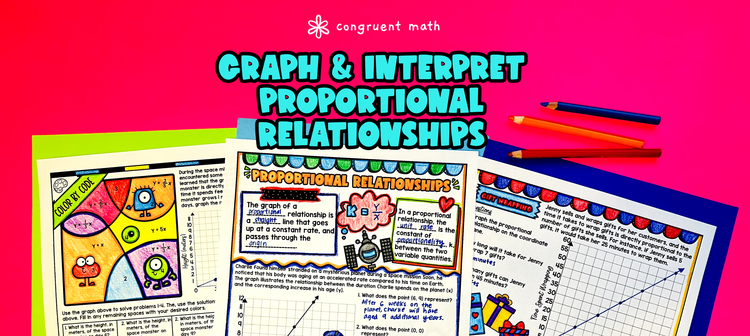
In this lesson plan, students will learn about representing proportional relationships through graphs and equations and explore their real-life applications. Then, they will also practice interpreting graphs of proportional relationships and understanding what the points represent in the context of the problem. Through artistic and interactive guided notes, checks for understanding, practice activities including a doodle & color by number worksheet, and a maze worksheet, students will gain a comprehensive understanding of proportional relationships.
The lesson culminates with a real-life application example that explores how proportional relationships are used in a practical context. Students will learn how to apply their knowledge of proportional relationships to solve real-world problems.
$4.25
After this lesson, students will be able to:
Before this lesson, students should be familiar with:
As a hook, ask students why understanding proportional relationships is important in real life. You can provide examples such as determining the amount of time it takes to complete a task, or comparing prices at the grocery store. Refer to the last page of the guided notes as well as the FAQs below for more ideas.
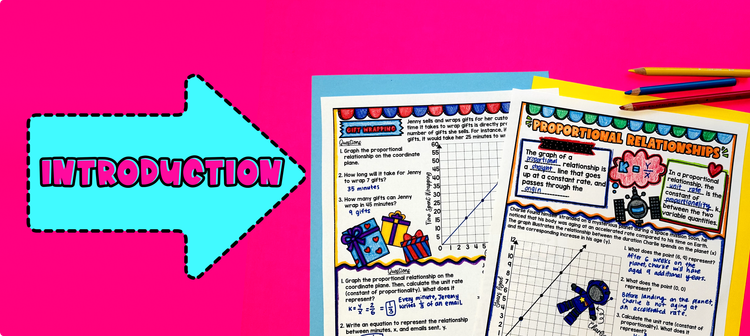
Use the first page of the guided notes to introduce the concept of representing proportional relationships with graphs and equations. Walk through the key points such as understanding what each point on the graph represents in terms of the situation, how to calculate the constant of proportionality & unit rate, and how to construct equations based on the constant of proportionality. You can model using the example of Charlie in space, as shown in the guided notes (page 1).
Based on student responses and understanding, reteach any concepts that students need extra help with. Then, have the students move onto the next page of guided notes (page 2) to practice constructing equations, graphing, interpreting graphs of proportional relationships. If your class has a wide range of proficiency levels, you can pull out students for reteaching, while more advanced students can work on the practice exercises independently.
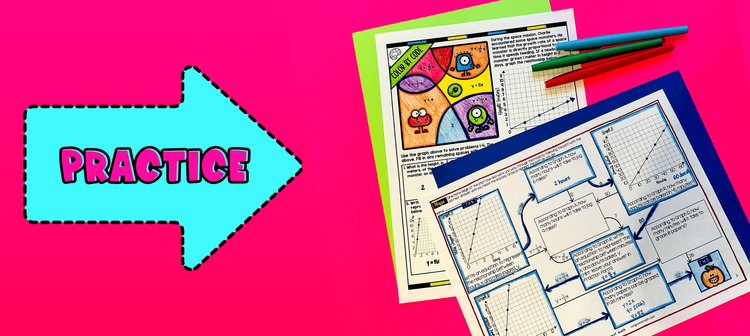
Have students practice graphing proportional relationships, interpreting graphs, and constructing equations using the maze activity (page 3), and color by number activity (page 4). Students will also be asked to solve for constant of proportionality in the practice. Walk around to answer student questions. You can also assign it as homework.
Use the last page of the guided notes (page 5) to bring the class back together, and introduce the concept of real-world application of proportional relationships. Explain to students that proportional relationships can be found in various real-life situations. These situations involve two quantities that change together at a constant rate or ratio.
Give examples of real-world scenarios where proportional relationships can be observed, such as:
Ask students if they can think of any other real-life situations that involve proportional relationships. Encourage them to share their ideas with the class.
Refer to the FAQ section in the resource for more ideas on how to teach real-life applications of proportional relationships.
If you’re looking for digital practice for Representing Proportional Relationships Graphs & Equations, try my Pixel Art activities in Google Sheets. Every answer is automatically checked, and correct answers unlock parts of a mystery picture. It’s incredibly fun, and a powerful tool for differentiation.
Here are some activities to explore:
A fun, no-prep way to practice Representing Proportional Relationships Graphs & Equations is Doodle Math — they’re a fresh take on color by number or color by code. It includes multiple levels levels of practice, perfect for a review day or sub plan.
Here are some activities to try:
A proportional relationship is a relationship between two quantities where the ratio of one quantity to the other remains constant. In other words, as one quantity increases or decreases, the other quantity increases or decreases by the same factor.
To represent a proportional relationship graphically, you can plot the ordered pairs on a coordinate plane. Each point on the graph represents a pair of values from the proportional relationship. The graph will show a straight line passing through the origin (0, 0), indicating a constant ratio between the two quantities.
To write an equation for a proportional relationship, you can use the formula y = kx, where y represents one quantity, x represents the other quantity, and k represents the constant of proportionality. The constant of proportionality is the ratio between the two quantities that remains constant.
In terms of the situation, a point (x, y) on the graph of a proportional relationship represents a particular combination of values for the two quantities involved. The x-coordinate represents the input or independent variable, while the y-coordinate represents the output or dependent variable. The point shows how the two quantities are related and how they change together.
To calculate the constant of proportionality, you can choose any two corresponding values from the proportional relationship. Divide the y-value by the x-value to find the ratio between the two quantities. The resulting ratio will be the constant of proportionality.
A unit rate is a rate that compares a quantity to one unit of another quantity. It tells you how much of one quantity is associated with one unit of another quantity. For example, if the constant of proportionality is 3, it means that for every 1 unit increase in the independent variable (x), the dependent variable (y) increases by 3 units.
Proportional relationships can be found in various real-life situations. Some examples include:
Guided notes and doodles are effective teaching tools that engage students and promote active learning. They provide structured notes and visual representations that support students in understanding and retaining the concepts. By including interactive elements like coloring and problem-solving activities, guided notes and doodles make the learning experience enjoyable and memorable for students. They also serve as valuable references for students to refer back to when practicing or reviewing the topic.
Get my free resource library with digital & print activities—plus tips over email.
Join for Free Resources →