Want to try before you buy?
Get my free resource library with digital & print activities—plus tips over email.
Join for free resources →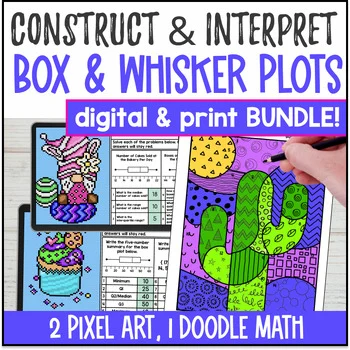
$8.24 $5.99
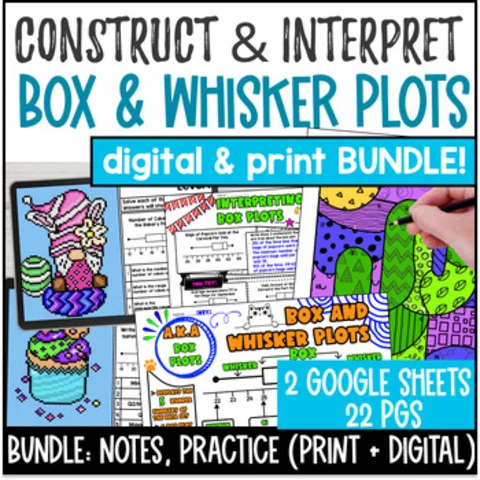
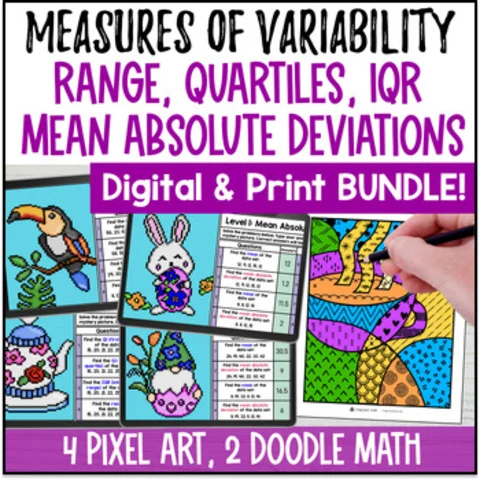
Buy on TPT →This data and statistics bundle consists of 2 products (2 DIGITAL Pixel Art Google Sheets + 1 PRINT doodle math worksheets activity). Students practice calculating minimum, Q1, median, Q3, maximum, and constructing and interpreting box and whisker plots. The images are themed after Spring, but is versatile enough that they can be used any time of the year!
This bundle contains multiple levels for differentiation to support creating and reading different graphs.
All activities are great as sub plan, review lesson, extra credit, extensions, or independent practice!
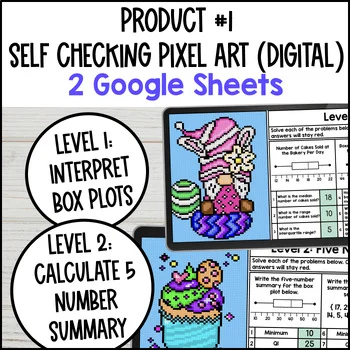
Product #1: Digital Pixel Art Box Plots (2 Google Sheets)
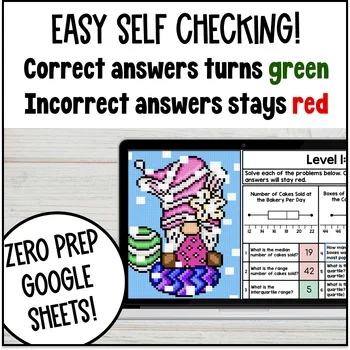
Students practice a series of problems on 2 google sheets, and get immediate feedback as they go. Correct answers turn green and incorrect answers stay red. As students type in correct answers, a mystery picture appears.
✅ Pixel Art Google Sheet #1: Interpreting Box Plots
✅ Pixel Art Google Sheet #2: Calculating 5 Number Summary (Minimum, 1st Quartile, Median, 3rd Quartile, Maximum)
✅ Instructions for use with Google Classroom and non-Google-Classroom platforms.
✅ Printable PDF worksheets for students to show work before typing into Google Sheets. (optional)
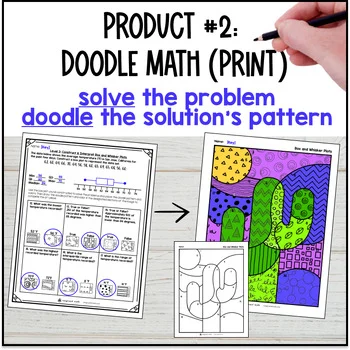
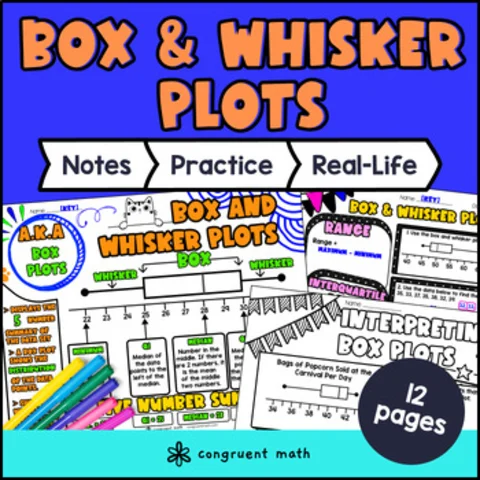
Product #2: Constructing and Interpreting Box and Whisker Plots
(Print - 8 Pgs Color & Doodle worksheets)
Students solve the problems in 3 levels, they unlock patterns/colors they can doodle in designated spaces to complete a mystery image. At the end of the activity, their solutions become a math masterpiece that's easy to spot-check at a distance. If your students love color by number or color by code, they’ll love Doodle Math!
✅ Level 1:Read & Interpret Box Plots (1 page)
✅ Level 2: Construct Box Plots (1 page)
✅ Level 3: Construct & Interpret Box Plots (1 page)
✅ 1 Image with designated sections for doodling. (1 page)
✅ Answer key (4 pages)
Great for…
⭐ Review Lessons
⭐ Emergency Sub Plans
⭐ Homeschool Activities
⭐ Homework & Independent Practice
⭐ Learning Centers & After School Math Programs
This resource covers the 6th grade common core standards:
✅ 6.SP.B.4 Display numerical data in plots on a number line, including dot plots, histograms, and box plots.
✅ 6.SP.B.5c Giving quantitative measures of center (median and/or mean) and variability (interquartile range and/or mean absolute deviation), as well as describing any overall pattern and any striking deviations from the overall pattern with reference to the context in which the data were gathered
Reviews for other Doodle Math products or pixel art products…
⭐⭐⭐⭐⭐ Christine M. - I put this out as an extra credit assignment...The students who chose to do it seemed to enjoy the "doodle" part because it was different than a typical color by number task. Thank you!
⭐⭐⭐⭐⭐ Micaela F. - “Great resource and activity!”
⭐⭐⭐⭐ Megan F. - “My kids loved being able to combine their love of art with our current math skill. It was challenging and fun at the same time.”
⭐⭐⭐⭐⭐ Teachertom (TpT Seller) - “My students loved this and the timing was perfect!”
⭐⭐⭐⭐⭐The Classy Teacher - "I used these with my accelerated 6th grade class. It was definitely challenging for them, but opened the floor for some great discussions and I think helped deepen their understanding of constant of proportionality."
Bundle
$8.99
Guided Notes
$4.25
Bundle
$8.99

Video Worksheets
$3.00
Get my free resource library with digital & print activities—plus tips over email.
Join for free resources →