Want to try before you buy?
Get my free resource library with digital & print activities—plus tips over email.
Join for Free Resources →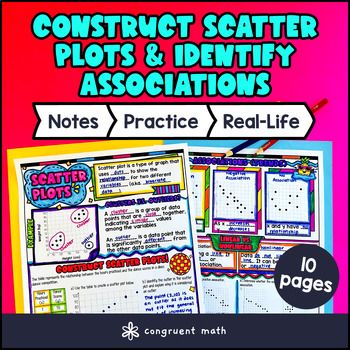
$4.25
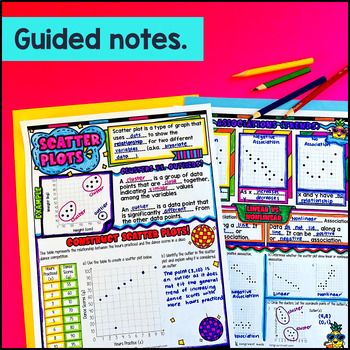
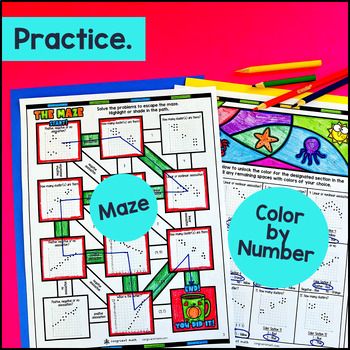
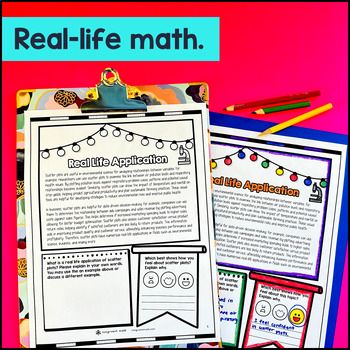
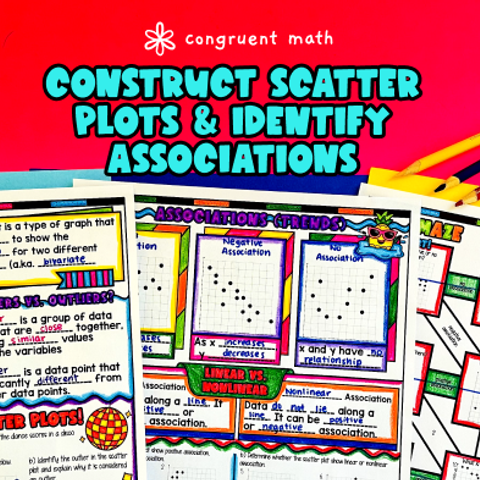
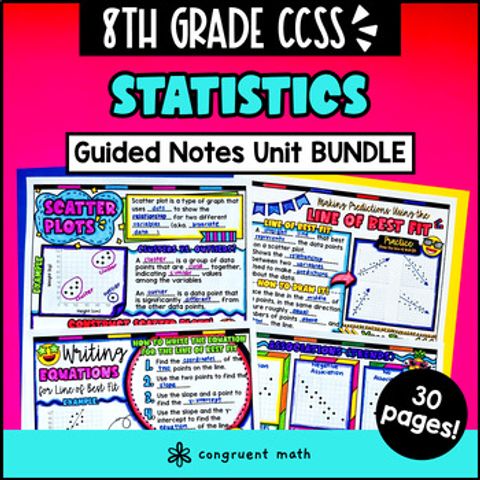
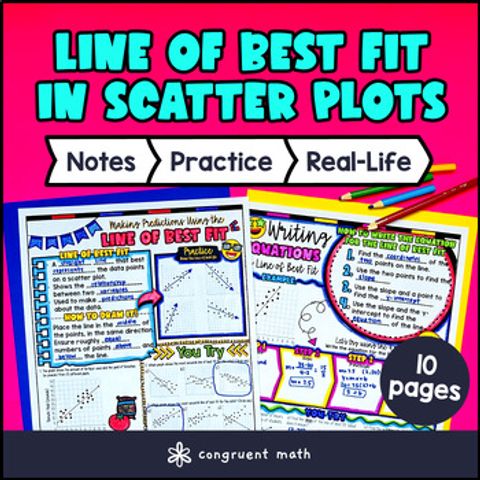
Buy on TPT →Get your 8th graders excited about statistics with our Printable PDF Guided Notes & Doodles for constructing scatter plots! This resource dives into bivariate data, helping students identify positive and negative associations, as well as linear versus nonlinear correlations. With engaging features like a coloring worksheet, a maze, and real-life math applications, this 10-page resource is perfect for interactive notebooks and graphic organizers. It aligns with standards for data analysis and probability, making it an ideal addition to your curriculum. Plus, it's artsy and fun!
CCSS Standards: 8.SP.A.1
Check out the preview for more details!
What's included with this resource:
Great for:
What teachers say about my Guided Notes & Doodles lessons:
Want a free sample?
Join my email list for access to my free resource library of digital activities, worksheets, and more. Download now!
Something not right?
If you have a question, or something is off with the lesson, please email me or post a question on TPT. I’ll do everything I can to make it right.
License
Each license of this product is for one teacher’s classroom and their students. If you wish to share with other teachers, please purchase additional licenses.
If you're interested in a quote for a campus or district license, please email me.
Copyright © 2023 Congruent Math LLC. All rights reserved.
Lesson Plans
FREE
Digital Activities
$11.97$8.99
Guided Notes
$12.75$8.99
Guided Notes
$4.25
Get my free resource library with digital & print activities—plus tips over email.
Join for Free Resources →