Want to try before you buy?
Get my free resource library with digital & print activities—plus tips over email.
Join for Free Resources →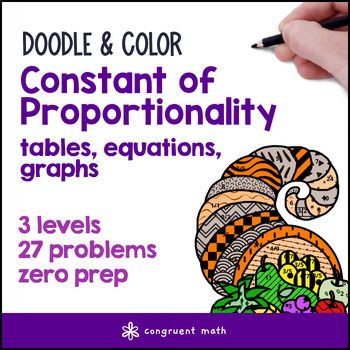

$3.00
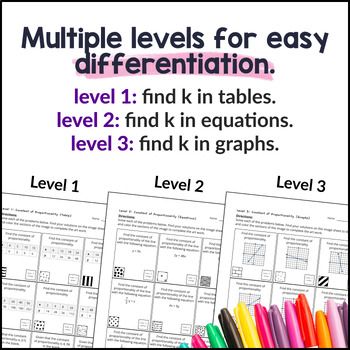
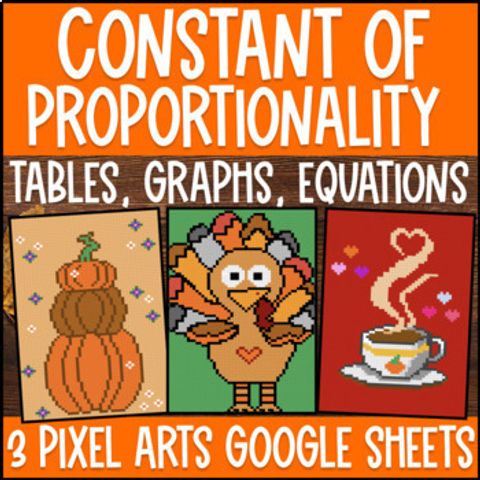
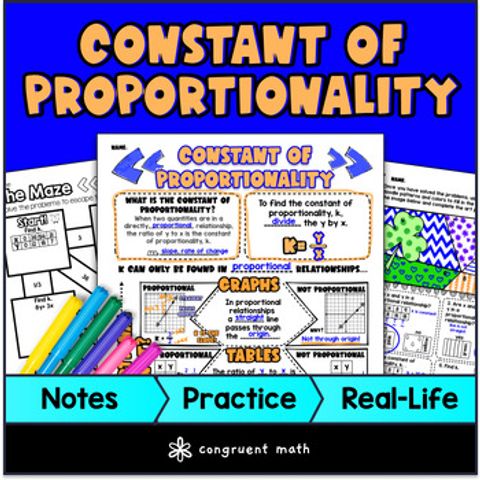
Buy on TPT →If you're looking for an engaging way to teach your middle school students about the constant of proportionality, this Doodle & Color by Number resource is perfect for you! Featuring 27 questions across three levels of difficulty, your students can practice finding k through tables, equations, and graphs while enjoying a fun autumn-themed activity. Not only does this resource align with the CCSS 7.RP.A.2.b standard, but it's also great for math centers, independent practice, or even emergency sub plans. Get ready for a festive twist on proportional relationships that your students will love!
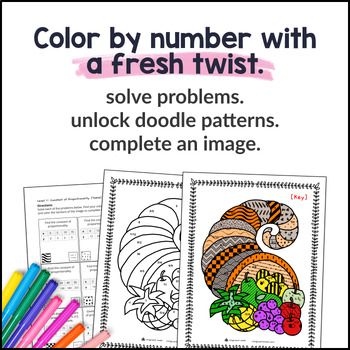
It's a fresh twist on color by number or color by code. Each correct answer unlocks a doodle pattern students can use to complete a mystery image with the colors of their choice. They keep students engaged, free up your time for differentiation, and look great as classroom decorations.
CCSS Standards: 7.RP.A.2b
Want more Doodle & Color by Number activities at huge savings?
This activity is in my 7th Grade and 6th - 8th Grade Doodle & Color by Number Bundles—at a savings of 50% over individual resources!
What’s included:
What teachers say about my Doodle & Color by Number activities:
Get a free sample!
I've made a collection of my activities available free. Download now!
Something not right?
If you have a question, or something is off with the lesson, please email me or post a question on TPT. I’ll do everything I can to make it right.
License
Each license of this product is for one teacher’s classroom and their students. If you wish to share with other teachers, please purchase additional licenses.
If you're interested in a quote for a campus or district license, please email me.
Copyright © 2023 Congruent Math LLC. All rights reserved.
Worksheets
$3.25
Digital Activities
$4.99
Digital Activities
$3.99
Guided Notes
$4.25
Get my free resource library with digital & print activities—plus tips over email.
Join for Free Resources →