Want to try before you buy?
Get my free resource library with digital & print activities—plus tips over email.
Join for Free Resources →

$3.99
Buy on TPT →This Printable PDF project lets your sixth graders dive into the world of statistics and probability by running Frankie's Arcade! They'll practice plotting and reading graphs while having a blast managing the arcade, making data analysis both fun and engaging. Aligned with CCSS 6.SP.A.3 and CCSS 6.SP.B.4, it’s perfect for real-life math connections and helps solidify important concepts through hands-on learning. Plus, it's an awesome way to link math with something they actually care about!
This is a great supplement activity for the 6th grade statistics curriculum reviewing how to create and analyze frequency tables, dot plots, histograms, and bar graphs.
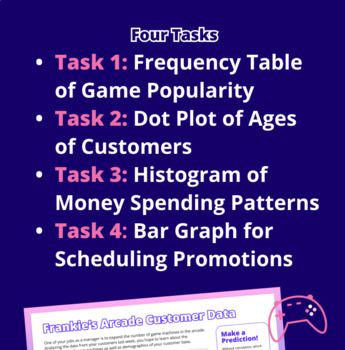
In this print-and-go activity, students complete four tasks to decide how to expand the arcade with new games, understand customer demographics and spend patterns, and select an optimal promotion schedule. It's a blast – and puts frequency tables, dot plots, histograms and bar graphs into real world context.
What's included?
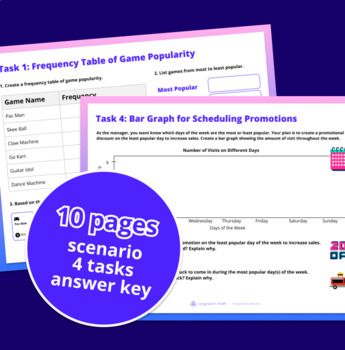
Your purchase includes a print-and-go PDF, with four tasks:
All in all, it contains 10 pages:
More Math Missions!
Warm-Ups
$3.00
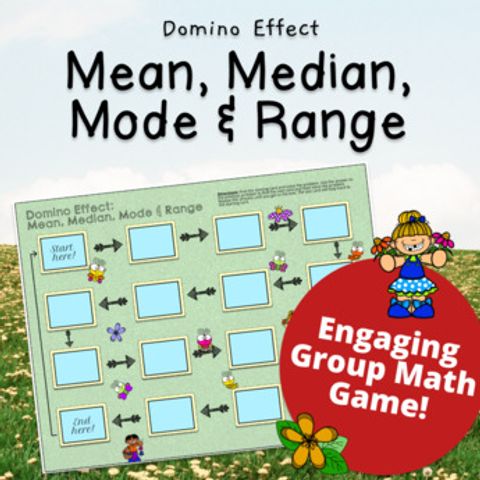
Games
$3.99
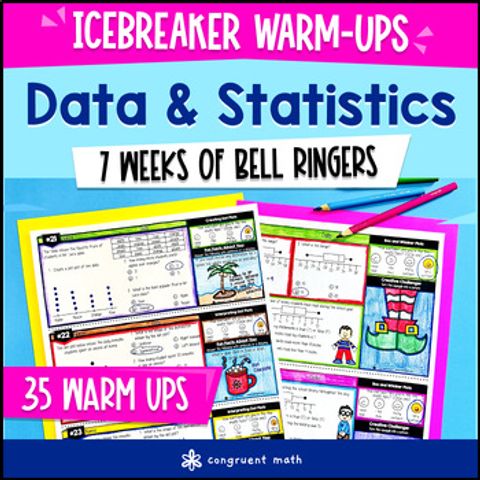
Warm-Ups
$6.99
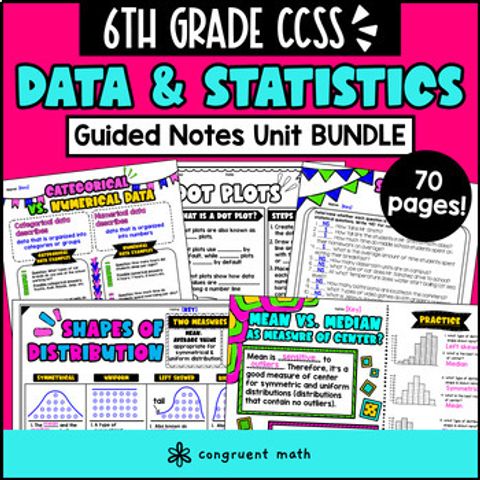
Guided Notes
$29.75$19.99
Get my free resource library with digital & print activities—plus tips over email.
Join for Free Resources →