Want to try before you buy?
Get my free resource library with digital & print activities—plus tips over email.
Join for Free Resources →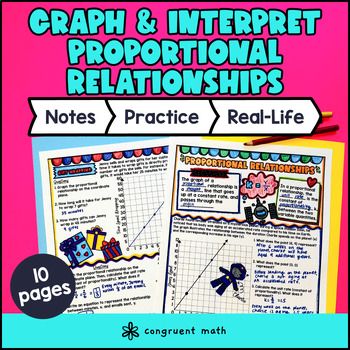
$4.25
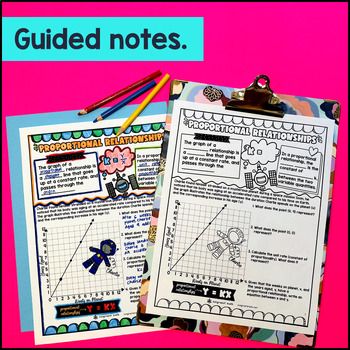
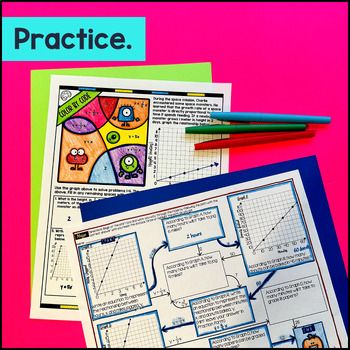
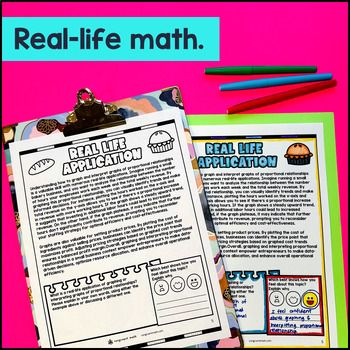
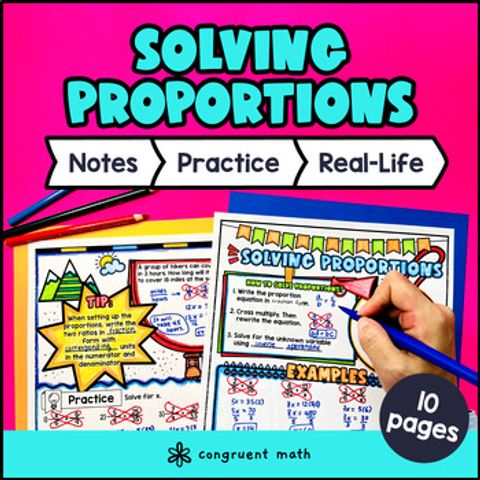
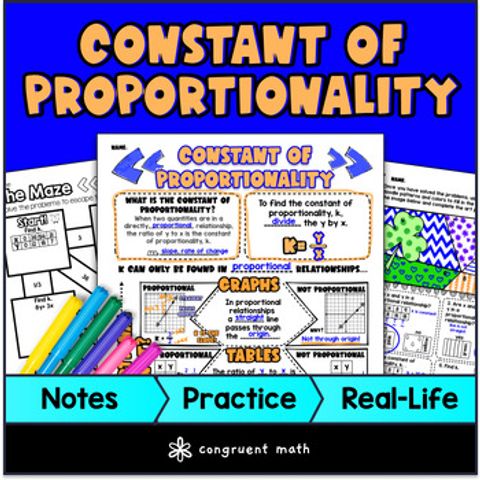
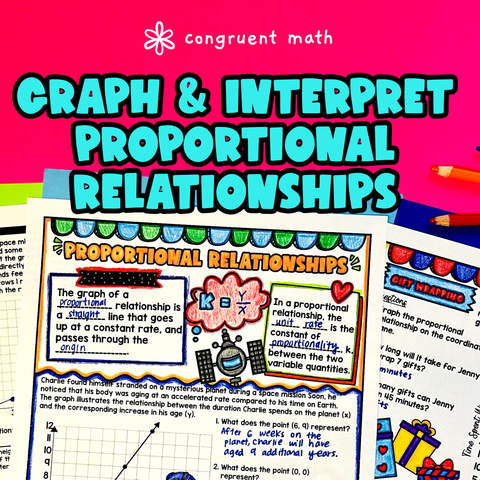
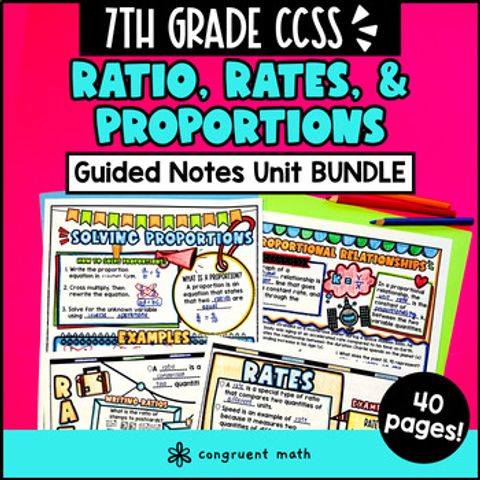
Buy on TPT →Teach 7th grade and 8th grade students how to write equations, construct graph and interpret graphs of proportional relationships using this Guided Notes & Doodles resource. This includes explain what a point (, ) on the graph of a proportional relationship means in terms of the situation, calculating constant of proportionality, and unit rates. It contains 10 pages total, including guided notes, a practice coloring worksheet, a maze, and a real-life math application. It works well as graphic organizers, scaffolded notes, and interactive notebooks. And it's artsy—if your students love color by number, color by code, or sketch notes, they'll love these lessons.
CCSS Standards: 7.RP.A.2a, 7.RP.A.2b, 7.RP.A.2c, 7.RP.A.2d, 8.EE.B.5
Check out the preview for more details!
Looking for a digital resource?
Get the Solving Proportions Pixel Art Google Sheets or Graphs of Proportional Relationships Pixel Art
What's included with this resource:
Great for:
What teachers say about my Guided Notes & Doodles lessons:
Want a free sample?
Join my email list for access to my free resource library of digital activities, worksheets, and more. Download now!
Something not right?
If you have a question, or something is off with the lesson, please email me or post a question on TPT. I’ll do everything I can to make it right.
License
Each license of this product is for one teacher’s classroom and their students. If you wish to share with other teachers, please purchase additional licenses.
If you're interested in a quote for a campus or district license, please email me.
Copyright © 2023 Congruent Math LLC. All rights reserved.
Guided Notes
$4.25
Guided Notes
$4.25
Lesson Plans
FREE
Guided Notes
$17.00$10.99
Get my free resource library with digital & print activities—plus tips over email.
Join for Free Resources →