Want more ideas and freebies?
Get my free resource library with digital & print activities—plus tips over email.
Join for free resources →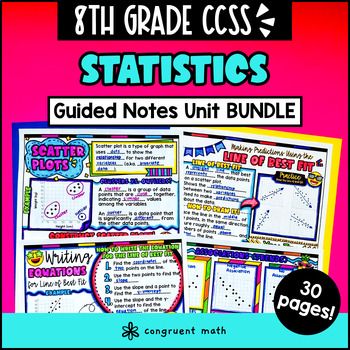
$8.99 · Extensions sold separately
Ever wondered how to teach the fundamentals of statistics in an engaging way to your 8th-grade students?
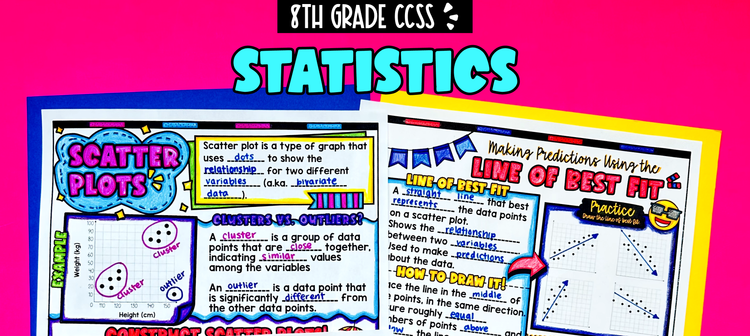
In this unit plan, students will first learn about constructing and interpreting two-way tables to analyze relationships between categorical variables. Later on, they will build on this knowledge to explore scatter plots and identify various associations, including the presence of outliers and clusters in data. Lastly, students will learn how to determine the line of best fit for bivariate data, make predictions, and interpret the slope and intercept in real-life contexts.
Each lesson supports students in mastering the unit through artistic, interactive guided notes and checks for understanding. The unit culminates with real-life examples that demonstrate how statistics play a vital role in data analysis and decision-making.
It's an exciting way to teach statistical concepts while comprehensively meeting standards.
$8.99 · Extensions sold separately
After this unit, students will be able to:
Before this unit, students should be familiar with:
Students will construct and interpret two-way tables to analyze the relationship between two categorical variables and calculate probabilities using relative frequency.
Students will learn how to construct scatter plots, identify associations (including positive, negative, and nonlinear relationships), and recognize outliers and clusters in bivariate data.
Students will learn how to determine the line of best fit for bivariate data, make predictions based on that line, and interpret the slope and intercept in real-life contexts.
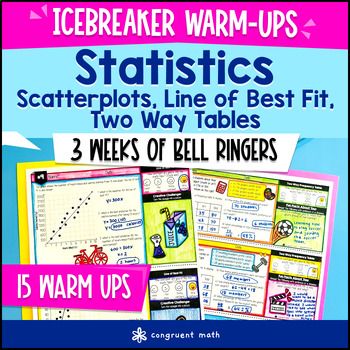
For additional daily spiral review, try my line of Icebreaker Warm-Ups. They contain two 5-10 minute questions to help students practice along with "getting to know you" questions and drawing activities for fast finishers.
$3.00
Looking to boost your 8th graders' understanding of statistics? These Printable PDF warm-up activities dive into scatter plots, lines of best fit, and two-way tables while aligning with CCSS standards. I’ve integrated icebreakers and creative challenges to make it fun and engaging. Each warm-up not only reinforces essential skills like interpreting associations and creating frequency tables but also helps students connect with one another. Perfect for kickstarting daily math practice, these activities will have your class participating and learning right from the bell!
$8.99
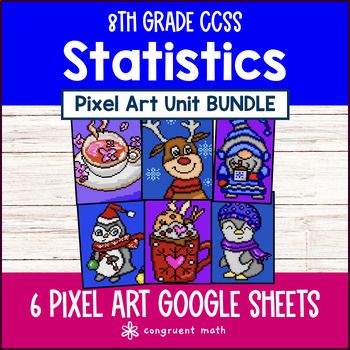
Check out our Statistics Scatter Plots Associations Pixel Art Bundle for 8th graders! This engaging unit covers essential topics like scatter plots, line of best fit, and two-way tables while aligning with CCSS 8.SP.A.1 and 8.SP.A.2. Using self-checking Google Sheets, students get instant feedback with colorful reactions—red for wrong answers and green for right ones—and unlock a fun mystery picture. It’s a great way to keep your class motivated while giving you the flexibility to focus on differentiation and other tasks.
Unit 6
Pythagorean Theorem, Angles & Volume
Get my free resource library with digital & print activities—plus tips over email.
Join for free resources →