Want more ideas and freebies?
Get my free resource library with digital & print activities—plus tips over email.
Join for Free Resources →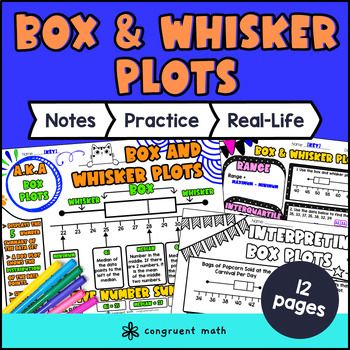
$4.25
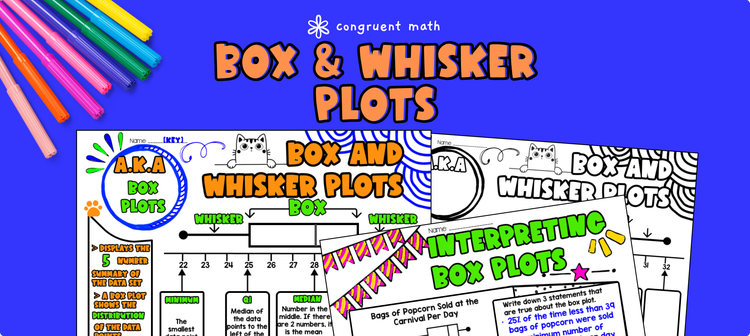
Ever wondered how to teach box and whisker plots, a.k.a. box plots, in an engaging way to your 6th grade students?
In this lesson plan, students will learn about steps to constructing box and whisker plots, interpreting data from box plots, and their real-life applications. Through artistic, interactive guided notes, check for understanding, maze, doodle & color by number activity, students will gain a comprehensive understanding of box and whisker plots.
The lesson culminates with a real-life example that explores how circles are used in amusement park rides like roller coasters and ferris wheels.
$4.25
After this lesson, students will be able to:
Before this lesson, students should be familiar with:
As a hook, ask students why understanding data visualization is important in real life. It may be helpful to refer to the last page of the guided notes as well as the FAQs below for ideas.
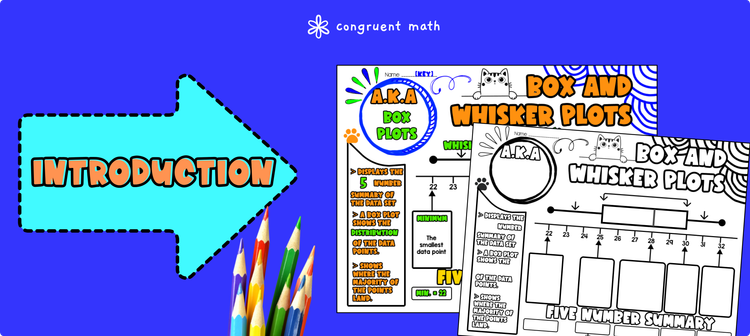
Use the guided notes to introduce the concept of box and whisker plots. Walk through the key points of the steps to construct a box and whisker plots. Review minimum, maximum, median, upper quartile, and lower quartile. Refer to the FAQ below for a walk through on this, as well as ideas on how to respond to common student questions.
Then, walk though the steps of interpreting box and whisker plots, including interquartile range and range.
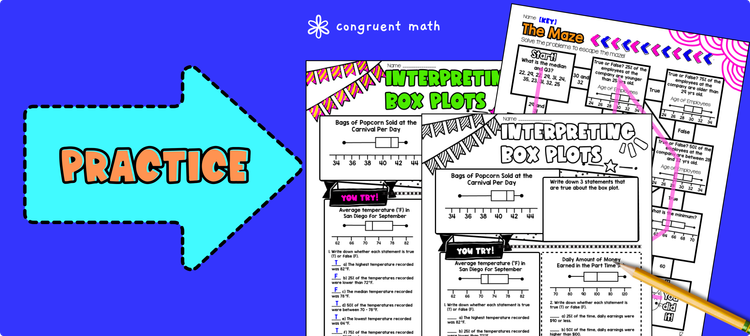
There are practice problems integrated in the guided notes. You can do the first example together as a class. Then, call on students to talk through their answers, potentially on the whiteboard or projector. Based on student responses, reteach concepts that students need extra help with.
While students are working on the box and whisker plots practice sheet activity, walk around to answer student questions.
Fast finishers can dive into the Maze activity or doodle math (similar to color by number) for extra practice. You can assign it as homework for the remainder of the class.”
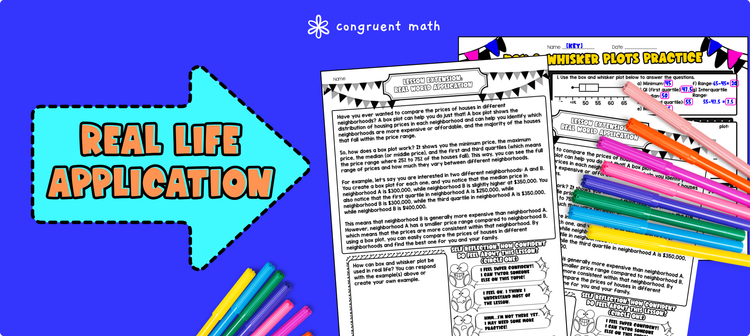
Bring the class back together, and introduce the concept of data visualization in comparing real estate. Explain how box plots can be used to compare the prices of houses in different neighborhoods. A box plot shows the distribution of housing prices in each neighborhood and can help you identify which neighborhoods are more expensive or affordable, and the majority of the houses that fall within the price range. Refer to the FAQ for more ideas on how to teach it!
If you're looking for digital practice for interpreting box and whisker plots, try the Pixel Art activity in Google Sheets. Every answer is automatically checked, and correct answers unlock parts of a mystery picture. It's incredibly fun, and a powerful tool for differentiation.
A fun, no-prep way to practice box and whisker plots is Box Plot Doodle Math — it's a fresh take on color by number or color by code. Students solve problems to unlock doodle patterns and colors. It includes 3 levels of practice, and it comes with mystery image when finished.
A box plot, also known as a box and whisker plot, is a graphical representation of numerical data that displays the distribution of the data by using five measures: minimum, lower quartile, median, upper quartile, and maximum.
To construct a box plot, you first need to find the minimum, lower quartile, median, upper quartile, and maximum of the data set. Then, draw a number line with the scale of your choice and plot these five values on the line. Draw a box from the lower quartile to the upper quartile, with a line through the box at the median. Draw whiskers from the box to the minimum and maximum values, and plot any outliers as individual points.
The interquartile range (IQR) is a measure of variability that is calculated as the difference between the upper quartile and the lower quartile. It is often used to identify potential outliers in a data set.
The range in a box plot is the distance between the minimum and maximum values in the data set.
Box plots can be used to compare the distribution of a variable across different categories or groups. For example, you can use box plots to compare the prices of houses in different neighborhoods. Box plots can also be used to identify potential outliers in a data set and to visualize the spread and variability of the data.
Get my free resource library with digital & print activities—plus tips over email.
Join for Free Resources →