

Want more ideas and freebies?
Get my free resource library with digital & print activities—plus tips over email.
Join for Free Resources →
$4.25
Ever wondered how to teach two-way tables in an engaging way to your 8th grade students?
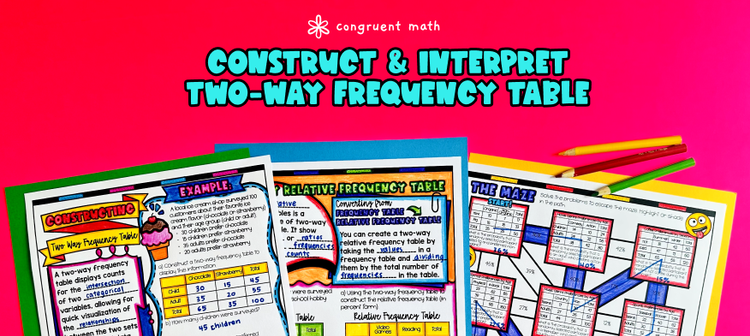
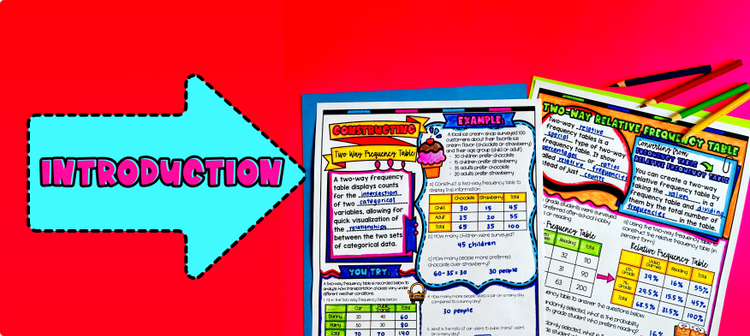
In this lesson plan, students will learn about two-way frequency tables and two-way relative frequency tables and their real-life applications. Through artistic, interactive guided notes, checks for understanding, a doodle & color by number activity, and a maze worksheet, students will gain a comprehensive understanding of constructing and interpreting two-way tables.
The lesson concludes with a real-life example that explores how to apply two-way tables in analyzing survey data or making informed decisions based on categorical variables.
$4.25
After this lesson, students will be able to:
Before this lesson, students should be familiar with:
As a hook, ask students why understanding relationships between categories, like favorite sports and snacks, is important. Encourage real-life examples where data informs decisions. Refer to the last page of the guided notes for applications and FAQs.
Use the first page of the guided notes to introduce two-way frequency tables, explaining how rows, columns, and intersections represent categories and frequency. Walk through the first example and discuss visual aspects. Use the FAQ for common questions. On the second page of the guided notes, show how to convert a frequency table to a relative frequency table and interpret the data.
Based on student responses, reteach as needed, offering extra help to struggling students while advanced students start practice exercises.
Have students practice constructing and interpreting two-way tables using the maze activity (page 3 of the guided notes). Walk around to answer student questions.
Fast finishers can get into the color by number activity (page 4 of the guided notes) for extra practice. You can also assign it as homework for the remainder of the class.
Bring the class back together, and introduce the concept of using two-way tables to analyze data in real-world scenarios, such as survey results, sports statistics, or academic performance across different subjects. Explain how two-way tables can help in visualizing relationships between two categorical variables, such as student study time and test scores.
Encourage students to think about instances in their own lives where they could collect data and represent it using a two-way frequency table, such as preferences for playlists among friends or class attendance tracked by subject and day of the week. This will not only reinforce their understanding but also highlight the practicality of this mathematical concept. Refer to the FAQ for more ideas on how to teach it!
If you’re looking for digital practice for constructing and interpreting two-way tables, try my Pixel Art activities in Google Sheets. Every answer is automatically checked, and correct answers unlock parts of a mystery picture. It’s incredibly fun, and a powerful tool for differentiation.
Here’s 1 activity to explore:
A two-way table is a statistical table that displays the frequency category of two categorical variables. It allows you to see how categories from one variable relate to categories from another.
To construct a two-way table, follow these steps:
The purpose of a two-way table is to:
To interpret a two-way table, examine the data to:
Relative frequencies are calculated by:
Two-way tables can be applied in various fields, including:
Two-way tables assist in probability calculations by:
Get my free resource library with digital & print activities—plus tips over email.
Join for Free Resources →