


Want more ideas and freebies?
Get my free resource library with digital & print activities—plus tips over email.
Join for Free Resources →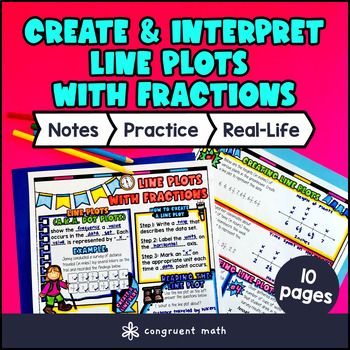
$4.25
Ever wondered how to teach creating and interpreting line plots with fractions in an engaging way to your 5th-grade students?
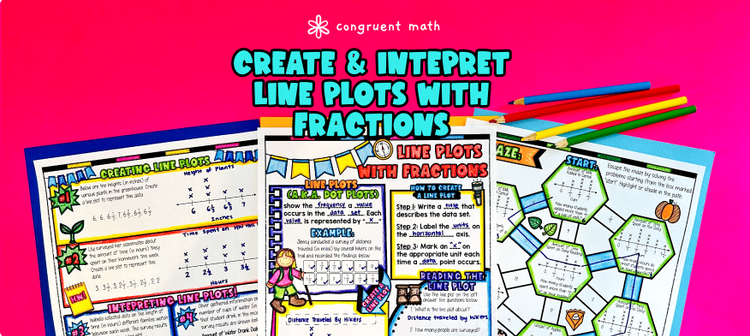
In this lesson plan, students will learn about line plots with fractions and their real-life applications. Through artistic, interactive guided notes, check for understanding, practice with a doodle & color by number activity, and a maze worksheet, students will gain a comprehensive understanding of line plots with fractions.
The lesson ends with a real-life example that explores how line plots with fractions can be used to organize and display data points and measurements effectively.
$4.25
After this lesson, students will be able to:
Before this lesson, students should be familiar with:
As a hook, ask students why understanding and creating line plots with fractions is important in real-life situations. Refer to the last page of the guided notes as well as the FAQs below for ideas.
Use the first page of the guided notes to introduce the concept of creating line plots with fractions. Walk through how to represent data points and measurements on a line plot using fractions. Emphasize the importance of organizing data accurately.
Continue with other sections of the guided notes to dig into reading and interpreting line plots with fractions. Teach students how to read and analyze the line plot to extract meaningful information. Highlight the relationship between data points and their fractional representations on the plot.
Have students practice creating and interpreting line plots with fractions using the second page of the guided notes. Refer to the FAQ below for ideas on how to respond to common student questions.
Based on student responses, reteach concepts that students need extra help with. If your class has a wide range of proficiency levels, you can pull out students for reteaching, and have more advanced students begin work on the practice exercises.
Have students practice creating and interpreting line plots with fractions using the practice, such as a maze activity (pg. 3) and color by number activity (pg. 4).
Circulate around the classroom to answer any student questions and provide assistance as needed. Fast finishers can engage in the real-life application activity included in the resource for additional practice. You may also opt to assign it as homework for those who finish early in class.
Using the last page of the guided notes, bring the class back together, and introduce the concept of how line plots with fractions are used in real-world scenarios such as gathering and analyzing data on student test scores, tracking the number of pages read each week in a reading log, or keeping track of the amounts of different ingredients used in recipes. Refer to the FAQ for more ideas on how to teach it!
If you’re looking for digital practice for creating and interpreting line plots with fractions, try my Pixel Art activities in Google Sheets. Every answer is automatically checked, and correct answers unlock parts of a mystery picture. It’s incredibly fun, and a powerful tool for differentiation.
Here’s 1 activity to explore:
A line plot with fractions is a visual representation of data points or measurements on a number line where fractions are used to show the values.
Key Points:
To create a line plot with fractions:
Key Steps:
The purpose of creating a line plot with fractions is to visually display and organize data in a way that helps in analyzing and interpreting fractional measurements efficiently.
Importance:
Line plots with fractions help in data interpretation by providing a clear visualization of fractional data points, making it easier to identify patterns, trends, and relationships within the data set.
Benefits:
Line plots with fractions are used in various real-life scenarios, such as:
Examples:
Line plots with fractions align with the 5th-grade Common Core Standards, specifically with the following standard: 5.MD.B.2, which focuses on representing and interpreting data.
Alignment:
Students may face challenges when working with line plots and fractions, such as:
Tips to Overcome Challenges:
Get my free resource library with digital & print activities—plus tips over email.
Join for Free Resources →