


Want more ideas and freebies?
Get my free resource library with digital & print activities—plus tips over email.
Join for Free Resources →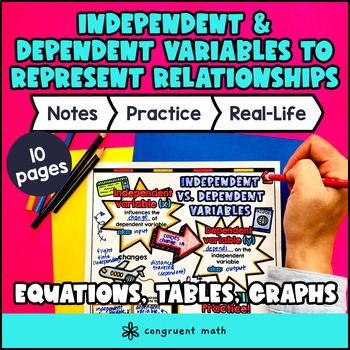
$4.25
Ever wondered how to teach representing quantitative relationships between independent and dependent variables in an engaging way to your 6th-grade students?
In this lesson plan, students will learn about independent and dependent variables and their real-life applications. Through artistic, interactive guided notes, check for understanding, and practice activities such as a doodle & color by number activity and a maze worksheet, students will gain a comprehensive understanding of how to identify independent and dependent variables, write equations, graph values, and fill tables. The guided notes provide structured instruction and integrate checks for understanding to ensure students are on the right track.
The lesson culminates with a real-life example that explores how the math skill of representing quantitative relationships applies to solving one-step equations in a real-life scenario.
This lesson plan is not only suitable for introductory lessons but also for reteaching and spiral review, homework assignments, substitute teacher plans, and quiz, test, and exam preparation. The resource includes guided notes, practice worksheets, a real-life application activity, and answer keys for all worksheets.
$4.25
After this lesson, students will be able to:
Before this lesson, students should be familiar with:
As a hook, ask students why do they think it is important to understand the relationship between independent and dependent variables? Refer to the last page of the guided notes as well as the FAQs below for ideas.
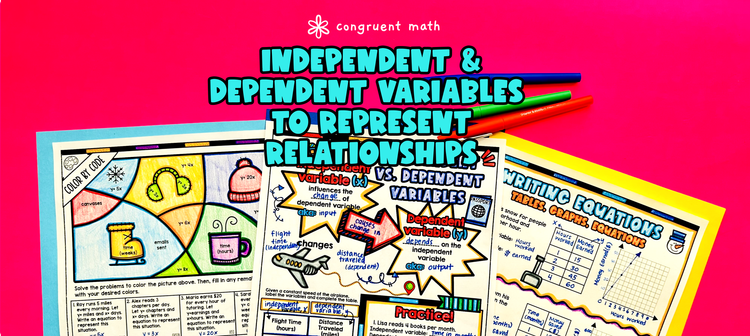
Use the first page of the guided notes to introduce the concept of independent variables vs. dependent variables. Walk through the key points of the topic, explaining that the independent variable is the one that can be controlled or changed, while the dependent variable is the one that responds to the changes in the independent variable. Emphasize the importance of understanding this relationship in various fields such as science, economics, and everyday life.
Use the bottom of the guided notes to teach students how to write equations and fill in tables to represent quantitative relationships between independent and dependent variables. Then use the second page of the guided notes to teach students how to graph quantitative relationships. Show examples and guide students through the process of identifying the independent and dependent variables and writing the equations accordingly. Clarify any misconceptions and encourage students to ask questions.
Have students practice representing quantitative relationships between independent and dependent variables using the practice problems on page 2 and maze activity on page 3.
Fast finishers can dive into the color by number activity on page 4 for extra practice. You can assign it as homework for the remainder of the class.
Using the last page of the guided notes, bring the class back together, and introduce the concept of real-world applications of independent and dependent variables. Explain to students that understanding how variables are related to each other is important in solving real-life problems.
Give examples of situations where independent and dependent variables are used. For example, explain how the distance a car can travel depends on the amount of gas in the tank. In this example, the amount of gas is the independent variable, while the distance the car can travel is the dependent variable.
Refer to the FAQ section for more ideas on how to teach real-life applications of independent and dependent variables.
If you're looking for digital practice for representing quantitative relationships between independent and dependent variables, try the Pixel Art activities in Google Sheets. Every answer is automatically checked, and correct answers unlock parts of a mystery picture. It's incredibly fun, and a powerful tool for differentiation.
Here is one activity to explore:
Independent and dependent variables are terms used in mathematics to describe the relationship between two quantities.
To identify the independent and dependent variables in a table:
To write an equation representing a quantitative relationship between independent and dependent variables, follow these steps:
To graph values from a table:
Guided notes are a valuable teaching tool in math lessons because they:
Get my free resource library with digital & print activities—plus tips over email.
Join for Free Resources →