

Want more ideas and freebies?
Get my free resource library with digital & print activities—plus tips over email.
Join for Free Resources →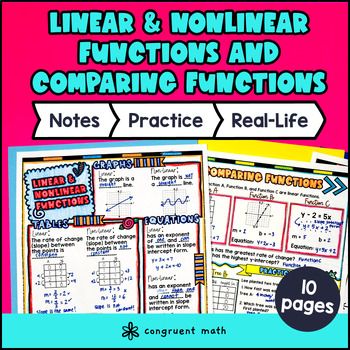
$4.25
Have you ever wondered how to teach linear and nonlinear functions or compare functions in an engaging way to your 8th grade students?
In this lesson plan, students will learn about linear and nonlinear functions, comparing functions, and their real-life applications. Through artistic and interactive guided notes, checks for understanding, a doodle and color by number activity, and a maze worksheet, students will gain a comprehensive understanding of identifying and comparing linear functions.
The lesson culminates with a real-life example that explores how linear functions can be applied to solve problems in everyday situations. Students will have the opportunity to read and write about the real-life uses of linear and nonlinear functions, further strengthening their understanding of the topic.
$4.25
After this lesson, students will be able to:
Before this lesson, students should be familiar with:
As a hook, ask students why it is important to be able to identify and compare linear and nonlinear functions. Refer to the last page of the guided notes as well as the FAQs below for ideas.
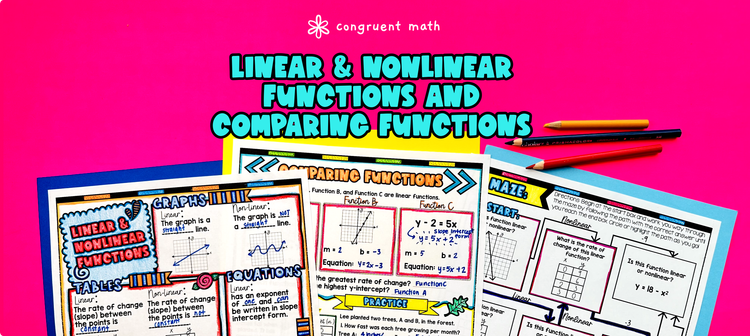
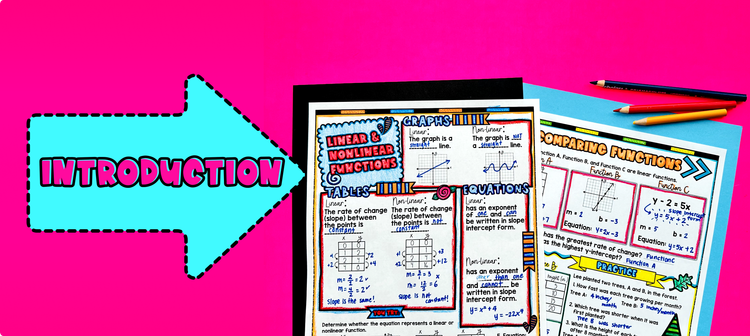
Use the first page of the guided notes to introduce the concept of linear and nonlinear functions. Explain that linear functions have a constant rate of change and can be represented by a straight line on a graph, while nonlinear functions do not have a constant rate of change and can be represented by a curved line on a graph. Walk through the key points of these characteristics and give examples of each for tables and equations as well. Students will fill in the blanks of the guided notes as you teach.
Then, move onto the second page of the guided notes to teach students how to compare functions (in graphs, equations, tables, and verbal description forms). Model the first example on the page (Function A vs. B vs. C) and then have students complete the remaining examples on the page.
Based on student responses, reteach the concepts of linear and nonlinear functions if needed. If your class has a wide range of proficiency levels, you can pull out students for reteaching, and have more advanced students begin work on the practice exercises.
Have students practice identifying linear and nonlinear functions and comparing functions using the practice activities in the guided notes. Have the students complete the maze (page 3) followed by the color by number worksheets (page 4).
The problems in the maze and color-by-number activities are great for reinforcing the concepts learned in the guided notes. Encourage students to use their completed guided notes as a reference while completing the practice worksheet.
Walk around the classroom to answer any questions students may have and provide feedback on their work.
Use the last page of the guided notes to bring the class back together, and introduce the concept of real-life applications of linear and nonlinear functions. Explain that linear functions can be used to model situations that have a constant rate of change, such as calculating distance traveled over time or determining the cost of items that are priced per unit. Nonlinear functions, on the other hand, can be used to model situations that have a variable rate of change, such as population growth or the depreciation of a car's value over time.
Invite students to brainstorm and share examples of real-life situations where linear and nonlinear functions can be applied. Encourage them to think about instances where they have encountered functions in their everyday lives, such as understanding how their allowance increases linearly over time or how the growth of social media followers can follow a nonlinear pattern.
This real life application activity allows students to read and write about real-life uses of linear and nonlinear functions. Students can use their critical thinking skills to connect the concept to the real world.
Provide additional examples if needed, such as the linear relationship between the number of hours worked and the amount earned or the nonlinear relationship between the height of a tree and its age.
Refer to the FAQ section of the lesson plan for more ideas on how to connect this concept to real-world scenarios and to address any questions or concerns students may have.
If you're looking for digital practice to reinforce the concepts of identifying linear and nonlinear functions and comparing linear functions, try these Pixel Art activities in Google Sheets. Every answer is automatically checked, and correct answers unlock parts of a mystery picture. It's incredibly fun and a powerful tool for differentiation.
Here are some activities to explore:
A linear function is a mathematical function in which the relationship between the input variable and the output variable is a straight line. In other words, when we graph a linear function, it forms a straight line.
Characteristics of a linear function:
A nonlinear function is a mathematical function in which the relationship between the input variable and the output variable is not a straight line. In other words, when we graph a nonlinear function, it does not form a straight line.
Characteristics of a nonlinear function:
To identify linear and nonlinear functions in tables, you can look for patterns in the values of the output variable.
For linear functions:
For nonlinear functions:
To identify linear and nonlinear functions in graphs, you can look at the shape of the graph.
For linear functions:
For nonlinear functions:
To identify linear and nonlinear functions in equations, you can look at the form of the equation.
For linear functions:
For nonlinear functions:
To compare linear functions, you can look at their rate of change (slope) and initial value (y-intercept).
Linear functions are often used to model situations where there is a proportional relationship between two variables. For example, the cost of buying multiple items with the same price.
Nonlinear functions are often used to model situations where the relationship between two variables is not proportional. For example, the distance traveled by a car over time, which is affected by acceleration and deceleration.
Yes, the resource includes guided notes, practice worksheets, and a real-life math application that will help you practice identifying and comparing linear functions. It provides various examples in tables, graphs, verbal descriptions, and equations to ensure a thorough understanding.
Get my free resource library with digital & print activities—plus tips over email.
Join for Free Resources →