
Want more ideas and freebies?
Get my free resource library with digital & print activities—plus tips over email.
Join for Free Resources →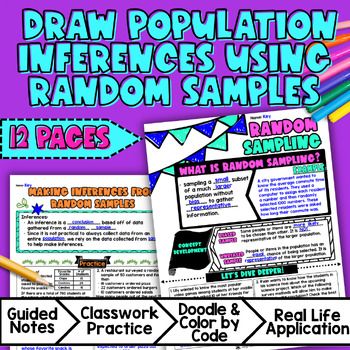
$4.25
Ever wondered how to teach population inferences and random sampling in an engaging way to your 7th grade students?
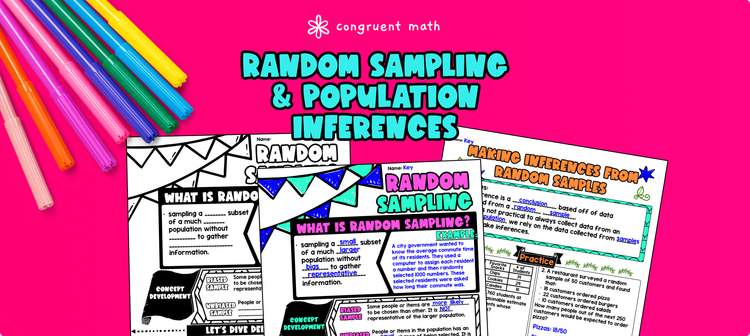
In this lesson plan, students will learn about population inferences and how data collected from random samples can be used to draw conclusions about a population. Through artistic and interactive guided notes, students will explore vocabulary terms such as random samples, biased samples, and representative samples. They will also learn how to identify and draw inferences from data collected through random sampling.
To reinforce their understanding, students will engage in word problems practice, a maze worksheet, and a doodle math activity (similar to a color-by-number activity). These exercises will help students practice their skills and solidify their understanding of population inferences and random sampling.
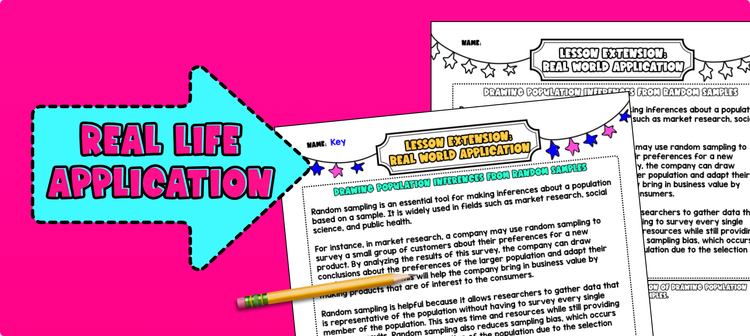
The lesson culminates with a real-life application, where students can read about how random sampling and population inferences are used in market research. This will help students see the practical relevance and real life applications of population inferences and random sampling.
Overall, this lesson plan provides a comprehensive and engaging approach to teaching population inferences and random sampling to 7th grade students.
$4.25
After this lesson, students will be able to:
Before this lesson, students should be familiar with:
As a hook, ask students why understanding random sampling and population inferences is important. For example, you could ask them why it is important to have a representative sample when conducting a survey or making predictions about a population. Refer to the last page of the guided notes as well as the FAQs below for ideas.
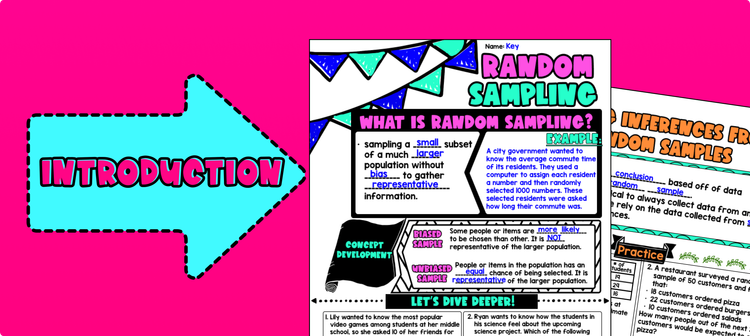
Use the first page of the guided notes to introduce the concept of random samples and population inferences. Walk through the key vocabulary terms, such as random samples, population inferences, biased samples, unbiased samples, and representative of the population. Explain what each term means and why they are important in statistics.
Use the second page of the guided notes to explain how to draw inferences by using data collected from random samples. Walk through the steps of what inferences are and why they are important. Discuss why random sampling tends to produce representative samples and support valid inferences. Go through the two examples in the guided notes resource. Refer to the FAQ below for a walk through on this, as well as ideas on how to respond to common student questions.
Based on student responses, reteach concepts that students need extra help with. If your class has a wide range of proficiency levels, you can pull out students for reteaching, and have more advanced students begin work on the practice exercises.
Have students practice drawing inferences about population using the "You Try" section of the guided notes resource. Walk around to answer student questions.
Fast finishers can dive into the maze activity and doodle math activity. for extra practice. You can assign it as homework for the remainder of the class or complete it as a group activity the next day.
Bring the class back together, and introduce the concept of real-life statistical questions. Explain to the students that statistics and population inferences play an important role in answering questions and making decisions in various real-life situations. Use the last page of the guided notes resource for discussion prompt and give students a place to reflect on their learning.
One example of a real-life application of population inferences is in market research. Explain to the students that companies often use random sampling and population inferences to make informed decisions about their products or services. For example, a company that produces a new flavor of potato chips may want to know if their target population (consumers in a certain age group or geographic region) will like the new flavor. Instead of surveying every individual in the population, the company can randomly sample a smaller group of individuals and use the data collected to draw inferences about the larger population. This helps the company make decisions about production, marketing, and distribution based on representative data.
Refer to the FAQ section of the lesson plan for more ideas on how to teach real-life applications of random sampling and population inferences.
If you’re looking for digital practice for population inferences and random sampling, try these Pixel Art activities in Google Sheets. Every answer is automatically checked, and correct answers unlock parts of a mystery picture. It’s incredibly fun, and a powerful tool for differentiation.
Here are some activities to explore:
Random sampling is a method used to select a subset of individuals or items from a larger population in a way that each member of the population has an equal chance of being chosen. This helps to ensure that the sample represents the population accurately.
Random sampling allows us to collect data from a smaller group (sample) and use it to make predictions or draw conclusions about a larger group (population). By ensuring that the sample is representative of the population, we can make valid inferences.
A biased sample is one in which certain individuals or items have a greater chance of being selected than others, leading to inaccurate representations of the population. An unbiased sample, on the other hand, is one in which all members of the population have an equal chance of being selected, resulting in a more accurate representation.
A sample is considered representative of the population if its characteristics closely match those of the entire population. We can assess the representativeness of a sample by comparing its demographics, features, or other relevant factors to the known characteristics of the population.
Population inferences refer to the conclusions or predictions we make about a larger group (population) based on data collected from a smaller group (sample). These inferences help us to make statements about the entire population without having to collect data from every individual or item.
Statistics, such as measures of central tendency and variability, can provide insights and useful information about a population. By analyzing data from a representative sample, we can make valid generalizations about the population as a whole.
To gauge the variation in estimates or predictions, we can generate multiple samples (or use simulated samples) of the same size. By comparing the results of these samples, we can observe the range of values and how they vary, helping us understand the uncertainty in our estimates or predictions.
One example of a real-life application is political polling. Instead of surveying the entire population, pollsters use random samples to estimate the voting intentions of the entire electorate. By generalizing the results from the sample to the larger population, they can make predictions about election outcomes.
Get my free resource library with digital & print activities—plus tips over email.
Join for Free Resources →