Want more ideas and freebies?
Get my free resource library with digital & print activities—plus tips over email.
Join for Free Resources →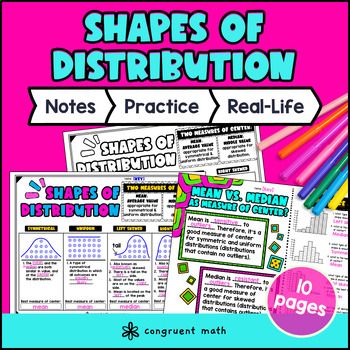
$4.25
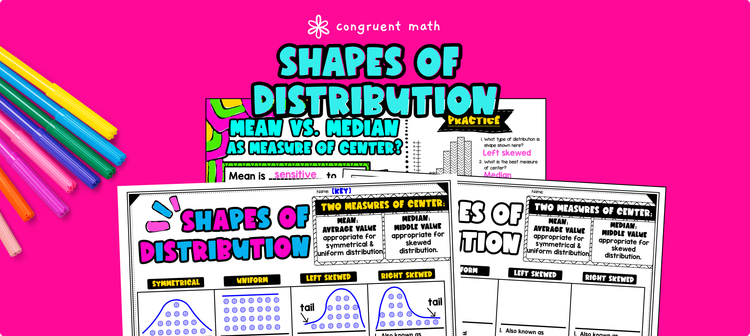
Ever wondered how to teach shapes of distribution and appropriate measure of center in an engaging way to your 6th grade students? In this lesson plan, students will learn about symmetrical, uniform, and skewed shapes of distribution and their real-life applications. They will also learn how to determine whether mean or median is the more appropriate measure of center, based on whether or not there are outliers in the data set.
Through artistic, interactive guided notes, a check for understanding, a maze worksheet, and a doodle & color by number activity, students will gain a comprehensive understanding of shapes of distributions and measure of center.
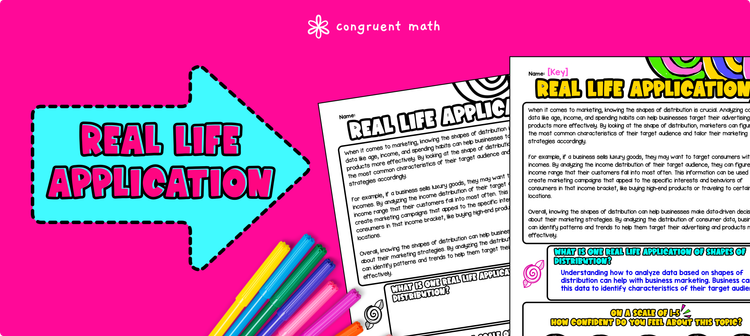
The lesson culminates with a real-life example that explores how analyzing consumer data like age, income, and spending habits can help businesses target their advertising and products more effectively.
$4.25
Before this lesson, students should be familiar with:
As a hook, ask students why analyzing consumer data is important for marketing. Refer to the last page of the guided notes as well as the FAQs below for ideas.
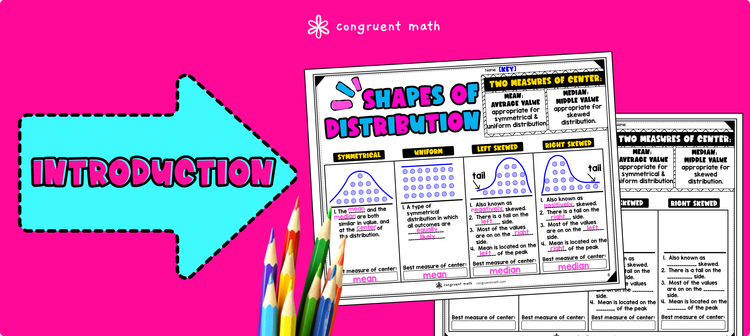
Use the guided notes to introduce the different shapes of distribution, noting how the “tails” of the distribution looks like for skewed distribution. Then introduce outliers and appropriate measure of center depending on whether or not the distribution is skewed.
Walk through the key points on the guided notes what students fill in their version of the notes. Refer to the FAQ below for a walk through on this, as well as ideas on how to respond to common student questions.
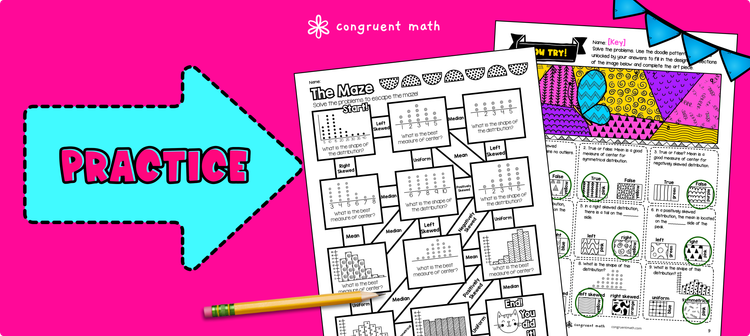
Have students practice identifying shapes of distribution and measure of center using the Maze activity. Students will distinguish between symmetrical and/or uniform distribution, left skewed, right skewed distributions. They will also be asked whether mean or median is a better measure of center based on distribution shapes. Walk around to answer student questions.
Fast finishers can dive into the Doodle & Color by Number activity for extra practice. You can assign it as homework for the remainder of the class.
Bring the class back together, and introduce the concept of analyzing consumer data for marketing purposes. explain how Analyzing consumer data like age, income, and spending habits can help businesses target their advertising and products more effectively.
Have students complete the real life application page on the guided notes packet.
If you’re looking for digital practice for shapes of distribution, try my Pixel Art activities in Google Sheets. Every answer is automatically checked, and correct answers unlock parts of a mystery picture. It’s incredibly fun, and a powerful tool for differentiation.
Alternatively, you can try the math detective video math activity on shapes of distribution. Students play the role of a math detective trying to solve statistical problems involving shapes of distribution to unlock a secret message. It’s completely zero prep. Just play the math detective mission video and have students work together in group.
Get my free resource library with digital & print activities—plus tips over email.
Join for Free Resources →