Want more ideas and freebies?
Get my free resource library with digital & print activities—plus tips over email.
Join for Free Resources →
$4.25
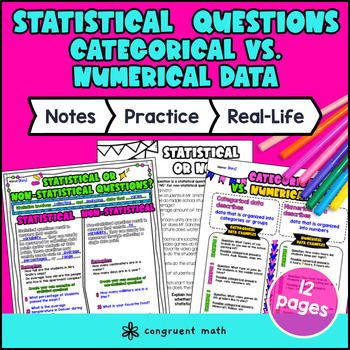
Ever wondered how to teach statistical vs. non-statistical questions and categorical & numerical data in an engaging way to your 6th-grade students?
In this lesson plan, students will learn about these concepts and their real-life applications. Through artistic, interactive guided notes, check for understanding, a maze worksheet, and a doodle & color by number activity, students will gain a comprehensive understanding of statistical vs. non-statistical questions and categorical vs. numerical data.
The lesson culminates with a real-life example that explores how knowing how to craft statistical questions can be useful in various real-life scenarios, such as businesses using statistical questions to gather data on customer preferences and behaviors or governments collecting data on population demographics and social issues to inform policy decisions.

$4.25
After this lesson, students will be able to:
There are no prerequisites needed for this lesson!
As a hook, ask your students to brainstorm why learning about statistics might important. Refer to the last page of the guided notes as well as the FAQs for ideas.
Use the guided notes to introduce the concepts of statistical vs. non-statistical questions and categorical vs. numerical data. Walk through the key characteristics of statistical questions and how to craft a statistical questions. Refer to the FAQ below for a walk-through on this, as well as ideas on how to respond to common student questions.
Then, introduce categorical vs. numerical variables. This is on page 3 of the guided notes.
Have students practice differentiating between statistical and non-statistical questions and identifying categorical and numerical data using the "statistical or not" questions on page 2 of the guided notes. Call on students to explain their answers and their rationale, potentially on the whiteboard or projector.
Then, have students practice crafting categorical and numerical data examples on the bottom of page 3. Based on student responses, reteach concepts that students need extra help with.
Walk around to answer student questions. Fast finishers can dive into the maze worksheet, page 4 of guided notes, for extra practice. You can assign the doodle math, which is on page 5, as homework for the remainder of the class.
Bring the class back together, and introduce the concept of real-world data analysis. Discuss how knowing how to craft statistical questions can be useful in various real-life scenarios, such as businesses using statistical questions to gather data on customer preferences and behaviors or governments collecting data on population demographics and social issues to inform policy decisions. Refer to the FAQ for more ideas on how to teach this concept!
If you're looking for digital practice for Statistical vs. Non-Statistical Questions and Categorical & Numerical Data, try my Pixel Art activities in Google Sheets. Every answer is automatically checked, and correct answers unlock parts of a mystery picture. It's incredibly fun, and a powerful tool for differentiation.
Here are 1 activities to explore:
Statistical questions are those that can be answered using data and statistical methods. Non-statistical questions do not rely on data or statistical methods to be answered.
Categorical data is data that can be sorted into categories or groups. Examples of categorical data include gender, eye color, and favorite color.
Numerical data is data that can be measured or counted. Examples of numerical data include height, weight, and number of siblings.
Knowing how to craft statistical questions and work with data is a valuable skill in fields such as science, economics, and social sciences. It allows us to make informed decisions and draw conclusions based on data.
Statistical questions and data can be used in various real-life scenarios. For instance, businesses can use statistical questions to gather data on customer preferences and behaviors, which can inform product development and marketing strategies. Similarly, governments can use statistical questions to collect data on population demographics and social issues, which can inform policy decisions.
Examples of statistical questions include "What percentage of students in this school have a part-time job?" and "How many hours a day do people in this city spend on social media?".
Categorical data can be sorted into categories or groups, while numerical data can be measured or counted. For example, gender is categorical data, while height is numerical data.
The lesson plan includes guided notes on statistical vs. non-statistical questions and categorical vs. numerical data, a maze worksheet, and a doodle & color by number activity. It also includes a real-life application section where students will learn about the applications of statistical questions in various fields.
Get my free resource library with digital & print activities—plus tips over email.
Join for Free Resources →