

Want more ideas and freebies?
Get my free resource library with digital & print activities—plus tips over email.
Join for Free Resources →
$4.25
Ever wondered how to teach theoretical and experimental probability in an engaging way to your 7th grade students?
In this lesson plan, students will learn about probability concepts and their real-life applications. Through artistic and interactive guided notes, check for understanding activities, a doodle and color by number worksheet, and a maze worksheet, students will gain a comprehensive understanding of theoretical and experimental probability.
The lesson concludes with a real-life example that explores how probability can be applied in everyday situations.
$4.25
After this lesson, students will be able to:
Before this lesson, students should be familiar with:
As a hook, ask students why understanding probability is important in everyday life. For example, you can ask them why it's important to know the probability of winning a lottery or the probability of getting a certain outcome in a game. Refer to the last page of the guided notes as well as the FAQs below for more ideas on how to engage students in the discussion.
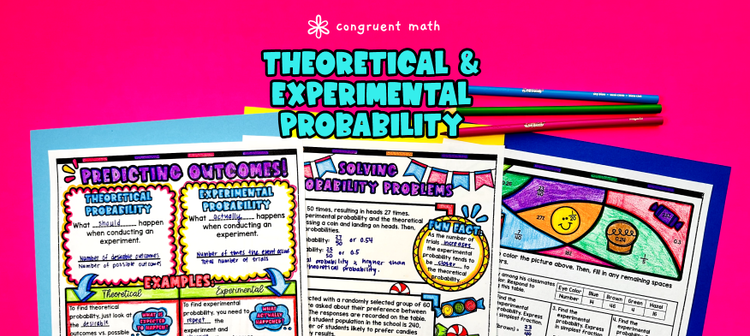
Use the first page of the guided notes to introduce the concept of theoretical probability vs. experimental probability. Walk through the key points of the topic, including how to calculate the theoretical probability of an event. Emphasize that theoretical probability is based on what we expect to happen in an ideal situation. Explain that experimental probability is based on collecting data from actual trials or experiments. Walk through the key points of the topic, including how to calculate the experimental probability of an event. Emphasize that experimental probability can vary from the theoretical probability because it is based on actual data. Refer to the FAQ below for a walk-through on this, as well as ideas on how to respond to common student questions.
Based on student responses, reteach any concepts that students need extra help with. If your class has a wide range of proficiency levels, you can pull out students for reteaching, and have more advanced students begin work on the practice exercises.
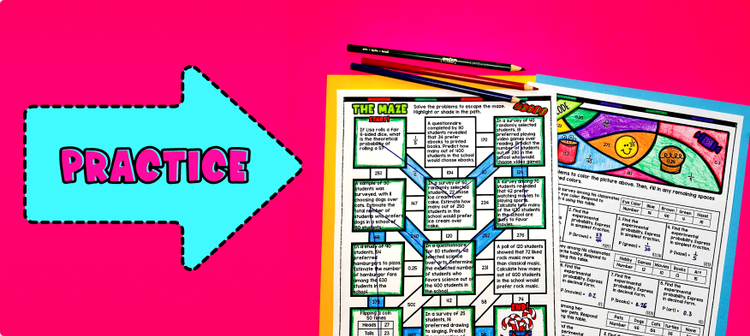
Have students practice theoretical and experimental probability using the practice worksheet activity (pg. 2 of guided notes). Walk around to answer student questions.
Fast finishers can dive into the maze (pg. 3 of guided notes) and color by number activities (pg. 4 of guided notes) on the practice worksheet for extra practice. You can assign it as homework for the remainder of the class.
Use the last page of the guided notes (pg. 5) to bring the class back together, and introduce the concept of real-life applications of probability. Explain to students that probability is used in many different fields and industries to help make informed decisions and predictions. Some examples of real-life applications include:
Refer to the FAQ section in the teaching resource for more ideas on how to incorporate real-life applications of probability into your lessons.
A fun, no-prep way to practice theoretical and experimental probability is Doodle Math. It's a fresh take on color by number or color by code. It includes multiple levels of practice, perfect for a review day or sub plan.
Here are some activities to try:
If you’re looking for digital practice for theoretical and experimental probability, try my Pixel Art activities in Google Sheets. Every answer is automatically checked, and correct answers unlock parts of a mystery picture. It’s incredibly fun, and a powerful tool for differentiation.
Here are some activities to explore:
Theoretical probability is the probability based on mathematical calculations and reasoning, without any actual experimentation or data collection.
Theoretical probability is calculated by dividing the number of desired outcomes by the total number of possible outcomes.
Steps to calculate theoretical probability:
Experimental probability is the probability based on actual data collected from experiments or observations.
Experimental probability is calculated by dividing the number of times an event occurs by the total number of trials or observations.
Steps to calculate experimental probability:
The main difference between theoretical and experimental probability is that theoretical probability is based on mathematical calculations and reasoning, while experimental probability is based on actual data collected from experiments or observations.
Theoretical probability can be used in real-life situations to make predictions or informed decisions based on mathematical calculations and reasoning. For example:
Experimental probability can be used in real-life situations to make predictions or draw conclusions based on actual data collected from experiments or observations. For example:
To teach theoretical and experimental probability effectively, consider the following strategies:
Get my free resource library with digital & print activities—plus tips over email.
Join for Free Resources →