Want more ideas and freebies?
Try a free sample of my digital & print resources—plus tips over email.
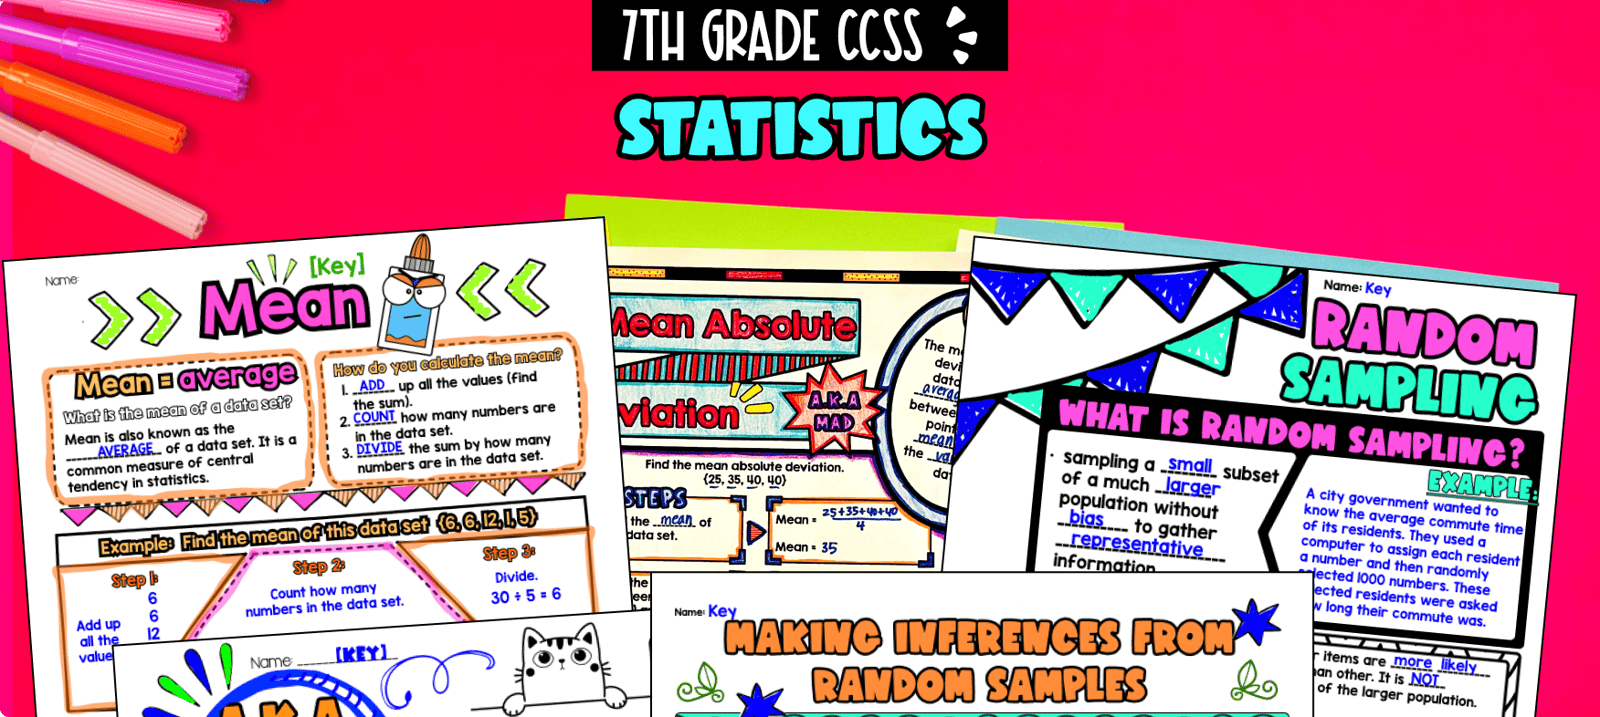
Join to Try Free Resources →Ever wondered how to teach statistical concepts in an engaging way to 7th-grade students? In this unit plan, students will first learn about mean, median, and mode as measures of central tendency. They will then delve into mean absolute deviation, a measure of variability, and later explore constructing and interpreting box and whisker plots to analyze data distribution.
Each lesson helps students master the unit through artistic, interactive guided notes, check for understanding activities, and culminates with a real-life example that explores how statistical concepts are applied in making population inferences from random sampling. It's an exciting way to teach statistics comprehensively while meeting 7th-grade Common Core Standards.
After this unit, students will be able to:
Before this unit, students should be familiar with:
Students will learn about mean, median, and mode measures of central tendency.
Students will learn about mean absolute deviation, statistics, and measure of variability in this lesson.
Students will learn about box and whisker plots, how to construct them from a data set, and how to interpret them to analyze data distribution, including range, Q1, Q2, and IQR.
Students will draw inferences of populations from random sampling.
$14.99
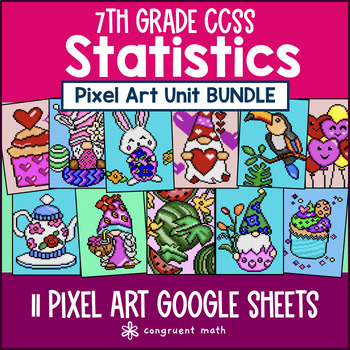
Students practice statistics including measures of center (i.e. mean, median, mode), and measures of spread and variability (i.e. range, interquartile range, mean absolute deviations), interpret box and whisker plots, random sampling, population inferences, and comparing populations with this 7th Grade CCSS Statistics Pixel Art Unit Bundle. Contains 5 products with 11 pixel art activities total for a complete 7th grade Common Core statistics unit.
$3.99
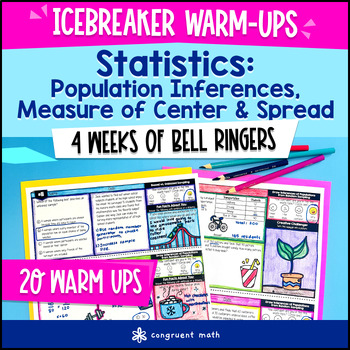
Engage your 7th grade students with drawing population inferences from random sampling, comparing populations using measures of center and measures of variability with this daily math review warm ups activities! This math bell ringers resource contains 20 days of practice on calculating mean, median, mode, range, mean absolute deviations, and applying it to make population inferences and compare populations.
Try a free sample of my digital & print resources—plus tips over email.
Join to Try Free Resources →