Want more ideas and freebies?
Get my free resource library with digital & print activities—plus tips over email.
Join for Free Resources →
$4.25
Have you ever wondered how to teach mean median and mode in a fun way to your 5th and 6th grade students?
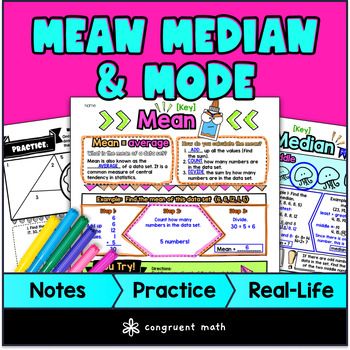
In this lesson plan, students will learn about measures of central tendency and their real-life applications. Through artistic, interactive, guided notes, a doodle & color by number worksheet, and a maze activity, students will gain a comprehensive understanding of mean, median, and mode.
The lesson culminates in a real life example that explores how sports analysts decide which players are performing the best, and which should be replaced based on calculations.

$4.25
After this lesson, students will be able to:
Note: This lesson plan doesn't cover range. See "extensions" for ideas!
Before this lesson, students should be familiar with:
If you’re looking for digital practice for mean, median, and mode, try my Pixel Art activities in Google Sheets. Every answer is automatically checked, and correct answers unlock parts of a mystery picture. It’s incredibly fun, and a powerful tool for differentiation. There’s Easter, Valentine’s Day, and year-round Minecraft-themed versions.
If you’re looking for practice problems for range, in addition to mean, median, and mode, try my Doodle Math print activity, and Domino Effect collaborative math game.
A data set is a collection of numerical values or other data points.
Outliers are data points that are significantly different from the rest of the data.
Measures of central tendency are statistical values that represent the center or middle of a data set. Mean, median, and mode are examples of measures of central tendency.
Mean, median, and mode are all measures of central tendency used in statistics.
Mean is the average, median is the middle, and mode is the most frequent.
Mean, median, and mode are calculated in slightly different ways:
If you have a student that needs a video explainer, here’s a helpful Khan Academy video:
In the context of sports analytics, mean, median, and mode can be used to evaluate player performance based on statistics like on base percentage, batting average, and wins above replacement.
Batting average is a statistic used in baseball to measure a player's performance at the plate. It is calculated by dividing the number of hits a player has by the number of times they have at-bats. In statistics, batting average is an example of mean, which is a measure of central tendency used to represent the center or middle of a data set.
On base percentage (OBP) is a baseball statistic that measures how often a player reaches base. It is calculated by dividing the total number of times the player has reached base (hits, walks, hit by pitch) by the total number of plate appearances (at-bats, walks, hit by pitch, sacrifice fly). While OBP is technically an example of mean in statistics, as it represents the average rate at which a player reaches base. However, like median, it is less affected by outliers than mean. For example, if a player has an OBP of .500 but only gets on base in one of their ten plate appearances, their median would be .100, whereas their mean would be .500.
Wins above replacement (WAR) is a baseball statistic that measures a player's value in comparison to a "replacement level" player. A replacement level player is defined as a player who is readily available to be signed from the minor leagues or free agency. WAR is calculated by comparing a player's performance to that of a replacement level player, and then adjusting for the player's position and the park in which they play.
In statistics, WAR is an example of a measure of central tendency called mode, which represents the most common or frequent value in a data set. In the case of baseball, a player's WAR is often used to determine their overall value and contribution to their team.
Get my free resource library with digital & print activities—plus tips over email.
Join for Free Resources →